HVAC Industry Statistics & Energy Data: Key Numbers 2026
July 10, 2026
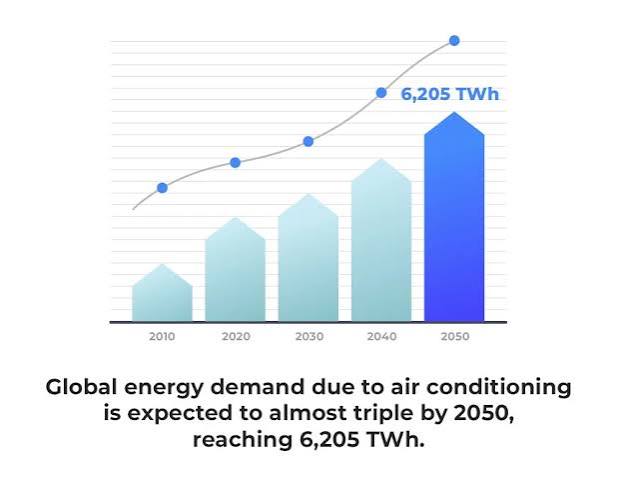
HVAC industry statistics & energy data: key numbers for 2026
⏱️ 8 min read · Last updated: 2026
HVAC industry statistics and energy data are scattered across DOE reports, AHRI shipment tables, and ENERGY STAR databases — rarely in one place. If you are looking for the latest HVAC industry statistics and energy data for 2026, this reference pulls together the numbers that matter most: how much heating and cooling costs, how long systems last, what replacement runs, and how efficiency standards have changed. The goal is simple: give you a clear, practical summary you can use right away.
- Heating and cooling account for approximately 43% of a typical U.S. home’s total energy bill, per the Department of Energy.
- The average HVAC lifespan is 15–20 years for central air systems and furnaces; heat pumps commonly reach 15 years with proper maintenance.
- A full HVAC system replacement costs $7,000–$12,500 installed nationally, with high-efficiency units at the top of that range.
- SEER2 standards took effect January 1, 2023, requiring minimums of 14.3 SEER2 (North) and 15.2 SEER2 (South and Southwest).
- The U.S. HVAC market exceeds $25 billion annually, with heat pump shipments rising year-over-year as electrification mandates expand.
The five numbers that frame HVAC industry statistics energy data
These five figures give you the fastest orientation to the HVAC landscape in 2026. They also make it easier to compare HVAC industry statistics and energy data across different sources. Each one is self-contained and citable.
- 43% — share of total U.S. home energy use attributable to heating and cooling, per the Department of Energy’s Residential Energy Consumption Survey.
- 15–20 years — average HVAC lifespan for central air conditioning and gas furnace systems under normal maintenance schedules.
- $5,000–$12,500 — national range for a full HVAC system replacement, installed, as of 2026; single-component replacements run lower.
- 14.3–15.2 SEER2 — minimum SEER2 rating for new residential central air systems shipped after January 1, 2023, depending on region.
- $25 billion+ — estimated annual U.S. HVAC market size, with residential equipment accounting for the majority of volume.
What is the average lifespan of an HVAC system?
The average HVAC lifespan is 15–20 years for central air conditioners and gas furnaces, and approximately 15 years for heat pumps. Those figures come from the Department of Energy and ENERGY STAR program guidance. Real-world results vary based on climate zone, maintenance frequency, and original equipment quality.
That average is only a starting point. A system in Phoenix running 10-plus months per year ages faster than one in Minneapolis running six. A unit that has never had its coils cleaned or refrigerant checked commonly fails at 12–14 years. A well-maintained system in a moderate climate can run 22–25 years. Use the average as a planning benchmark, not a guarantee.
Lifespan by equipment type
| Equipment type | Typical lifespan | Key lifespan factors |
|---|---|---|
| Central air conditioner | 15–20 years | Annual tune-ups, coil cleaning, refrigerant level |
| Gas furnace | 15–20 years | Heat exchanger condition, filter replacement schedule |
| Heat pump (air-source) | 15 years | Runs year-round (heating + cooling), so wears faster |
| Boiler (gas or oil) | 20–30 years | Fewer moving parts than forced-air systems |
| Window AC unit | 8–12 years | Usage hours, filter cleaning, storage conditions |
| Ductless mini-split | 15–20 years | Filter cleaning frequency, refrigerant integrity |
The Department of Energy places the average HVAC lifespan for central systems at 15–20 years. Systems that miss annual maintenance checks commonly fail 3–5 years ahead of that benchmark.
If your system is past the 15-year mark and you’re weighing repair costs, the decision involves more than the repair bill. A useful framework for the repair or replace HVAC system decision accounts for remaining efficiency, refrigerant type, and projected energy savings from a modern unit.
How much of home energy use goes to heating and cooling?
Heating and cooling account for approximately 43% of total residential energy consumption in the United States. That makes HVAC the single largest energy expense in a typical home — larger than water heating, lighting, and appliances combined, according to the Department of Energy’s Residential Energy Consumption data.
That share changes with climate, so the next step is to look at where your home sits on the map. Homes in the Gulf Coast and Southwest commonly spend 50–60% of their energy budget on cooling alone. Homes in the Upper Midwest spend a similar share on heating. Knowing your regional split helps you identify where efficiency upgrades will pay off first.
Where home energy dollars actually go
| Energy end use | Approx. share of home energy bill |
|---|---|
| Space heating | ~29% |
| Air conditioning | ~14% |
| Water heating | ~14% |
| Appliances and electronics | ~21% |
| Lighting | ~10% |
| Other | ~12% |
Source: Department of Energy Residential Energy Consumption Survey (RECS). Figures represent national averages and will vary by climate zone, home size, and fuel type.
The heating-versus-cooling split matters for one practical reason: efficiency improvements hit hardest on your dominant load. If you spend $900 per year on HVAC and 70% goes to heating, upgrading to a high-efficiency heat pump that cuts heating costs by 30% saves roughly $190 per year. Run that math before choosing equipment — comparing SEER2 ratings in isolation tells only part of the story.
SEER2 adoption and what the efficiency shift actually means
SEER2 is the current federal efficiency standard for residential air conditioners and heat pumps, replacing the older SEER metric effective January 1, 2023. The Department of Energy introduced SEER2 to reflect more realistic field conditions — specifically, higher static pressure in duct systems. As a result, SEER2 ratings are slightly more conservative than equivalent SEER numbers from the old testing protocol.
A unit rated 15 SEER under the old standard translates to approximately 14.3 SEER2. The minimum for new central AC equipment shipped to the South and Southwest is now 15.2 SEER2; the northern minimum is 14.3 SEER2. Equipment below these thresholds cannot be manufactured for U.S. residential use, though pre-2023 inventory could still be installed by contractors working through existing stock.
What efficiency improvement actually looks like in dollars
Upgrading from a 10 SEER system (common in units from the early 2000s) to a 16 SEER2 system cuts cooling energy use by roughly 37–40%. On a $600-per-year cooling bill, that is $220–$240 in annual savings. Payback on the efficiency premium is commonly 6–9 years — faster in high-cooling climates, slower in moderate ones.
Upgrading from a 10 SEER system to a 16 SEER2 unit can cut residential cooling energy consumption by approximately 37–40%, based on the linear efficiency ratio between the two ratings.
ENERGY STAR certification for central air conditioners currently requires a minimum of 15.2 SEER2 in the South and 14.3 SEER2 in northern states. Higher ENERGY STAR tiers start at 16 SEER2. Those units qualify for federal tax credits under the Inflation Reduction Act, which extended residential efficiency incentives through 2032.
One important note when comparing equipment: SEER2 ratings use a standardized test protocol, but real-world performance depends on duct condition, home insulation, thermostat programming, and local climate. Understanding HVAC replacement cost by size and tonnage matters here too — an oversized high-SEER2 unit will short-cycle and underperform its rated efficiency.
HVAC market size and replacement cost trends in 2026
The U.S. HVAC market is valued at over $25 billion annually. Residential equipment and installation services represent the majority of that volume. Industry analysts commonly project 4–6% annual growth through the late 2020s, driven by end-of-life replacements from the large installed base of early-2000s systems and electrification policy pushing heat pump adoption.
Replacement costs rose sharply after 2021. Supply chain disruptions during 2021–2022 pushed installed HVAC costs up 15–25% in many markets. As of 2026, costs have leveled off, but they remain above pre-2021 levels. A standard central air conditioner replacement — 3-ton system, single-stage, 14.3 SEER2 — commonly runs $4,500–$7,000 installed. A full system replacement (air handler, condenser, and coil) typically falls in the $7,000–$12,500 range, depending on system complexity and region.
Replacement cost by system type (2026 national averages)
| System type | Typical installed cost range | Notes |
|---|---|---|
| Central AC only (condenser + coil) | $3,500–$7,500 | Existing air handler retained |
| Gas furnace only | $2,500–$6,000 | 80% vs. 96% AFUE drives cost variance |
| Full system (AC + furnace/air handler) | $7,000–$12,500 | Most common full replacement scenario |
| Air-source heat pump (full system) | $8,000–$15,000 | Federal tax credits available; offsets upfront cost |
| Ductless mini-split (1 zone) | $2,000–$5,000 | Scales up with additional zones |
Labor costs account for 40–50% of most installed HVAC replacement quotes in 2026. That share shifts higher in urban markets with high union labor rates — New York, San Francisco, Chicago — and lower in rural markets. For city-specific pricing, a dedicated HVAC repair city cost guide gives the most accurate local benchmarks.
One cost factor that surprises many homeowners is permits. Most jurisdictions require a permit for HVAC replacement. Fees range from $50 to $500 depending on municipality. Reviewing HVAC permit requirements before signing a contractor quote helps prevent delays and added costs later.
Two data points most HVAC articles never mention
Most HVAC industry statistics energy data roundups cover lifespan, cost, and SEER2 rating. These two figures rarely appear in those summaries — but both affect the repair-or-replace decision in 2026.
1. R-22 refrigerant phase-out and stranded system costs
Systems manufactured before approximately 2010 commonly use R-22 refrigerant (also called Freon). The EPA ended R-22 production and import under federal ozone rules, with the final ban taking effect in 2020. As of 2026, R-22 is available only as reclaimed stock, and prices have risen to $100–$200 or more per pound in many markets.
A system that needs a refrigerant recharge — common after a coil leak — can cost $800–$2,000 or more for the refrigerant alone, before any repair labor. That fact changes the repair-or-replace math significantly for older systems.
2. Duct leakage: the efficiency number no one quotes
The Department of Energy estimates that the average U.S. home loses 20–30% of conditioned air through leaky ductwork before it reaches living spaces. A new 16 SEER2 system installed on a leaky duct system effectively performs like a 12 SEER2 unit. You pay for high efficiency but get average results.
Professional duct sealing — aerosol or manual mastic application — typically costs $1,000–$2,500 and can improve delivery efficiency by 15–20%. The ROI timeline is under five years in most climates. Despite that, duct leakage almost never appears in standard HVAC statistics roundups.
How to cite this page
If you are referencing these figures in an article or report, cite as: “Elite Home Pros — HVAC Industry Statistics & Energy Data (2026).” Primary sources include the U.S. Department of Energy Residential Energy Consumption Survey (RECS), ENERGY STAR program guidance, AHRI shipment data, and EPA refrigerant phase-out regulations. Verify all figures against primary sources for formal academic or regulatory use.
- HVAC industry statistics energy data confirms that heating and cooling account for ~43% of total home energy use — more than any other category, per the Department of Energy.
- The average HVAC lifespan is 15–20 years. Systems over 15 years old running R-22 refrigerant face compounding cost risks.
- SEER2 replaced the SEER standard in 2023. New minimums are 14.3 SEER2 (North) and 15.2 SEER2 (South/Southwest).
- Duct leakage wastes 20–30% of conditioned air in a typical U.S. home. Sealing ducts before or during replacement protects your efficiency investment.
Common questions about HVAC industry statistics energy data
What are the latest HVAC industry statistics for 2026?
Key 2026 benchmarks: HVAC accounts for 43% of U.S. home energy use; average system lifespan is 15–20 years; full system replacement runs $7,000–$12,500 installed nationally; the U.S. HVAC market exceeds $25 billion annually; and SEER2 minimums of 14.3–15.2 apply to all new residential equipment shipped after January 1, 2023.
How can I use HVAC efficiency data to lower my energy bill?
Start by identifying your dominant load — heating or cooling — from your last 12 months of utility bills. Then compare your current system’s SEER or AFUE rating to today’s SEER2 minimums. Upgrading from a 10 SEER system to a 16 SEER2 unit can cut cooling costs by roughly 37–40%, with payback in 6–9 years in most climates.
Does heating or cooling cost more in a typical U.S. home?
Nationally, space heating accounts for approximately 29% of home energy use while air conditioning accounts for about 14%, per Department of Energy
Related: The bottom line · how to choose hvac contractor
See also: hvac repair [city]
See also: water damage restoration statistics
See also: how to choose hvac contractor
Related: AC not cooling troubleshooting: fix it step by ste